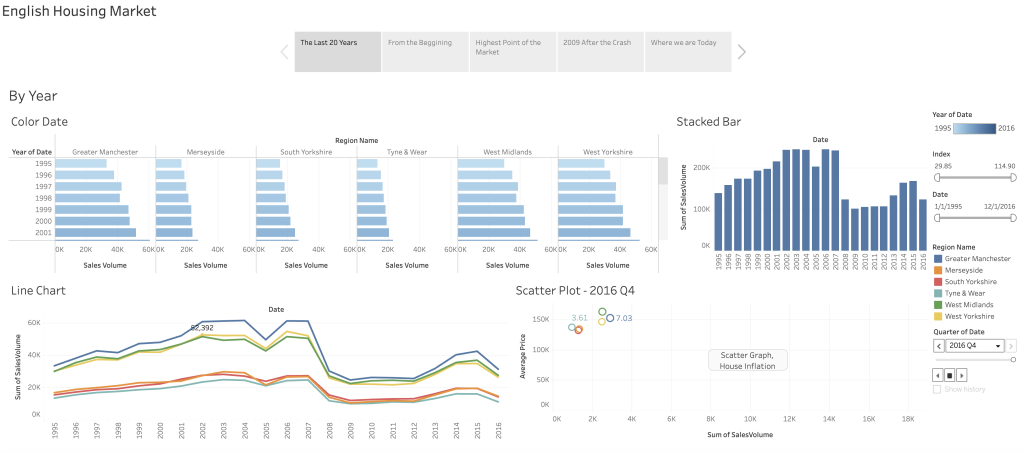
Tableau story points shows the various housing markets in Great Britain over the years.

Portfolio
A list of knowledge on Data Analysis and report writing.
Tableau story points shows the various housing markets in Great Britain over the years.
First, my favorite ETL and reporting tool, Alteryx. Nothing seems to come close. When delivering a report in Excel, Power Query is useful but can get you so far if the data is big, SQL turns into 100s of lines of code, and 10’s of steps needed in the power query process. Alteryx makes flow transparent especially if loops using macros are needed.
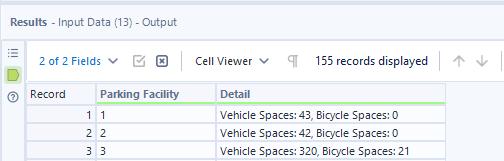
Detail column has 4 points of data in it. Text to Columns is first step to get 4 new columns the the Transform tool turns Vehicle Spaces and Bicycle Spaces in column headers.
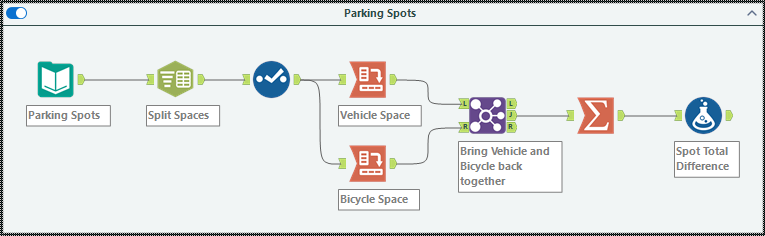
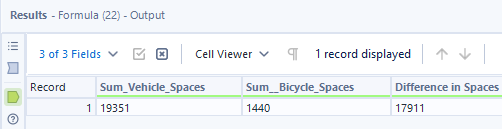
Summarize both spaces totals and subtract one from another in the Formula tool.

PowerShell like many data report apps, take advantage of Regular Expressions. If there were 10,000 filenames filled with punctuation and the names needed to be shortened, especially for the purpose of being visible in a URL, these filenames can be shortened and limited to alphanumeric characters only. This prevents a filenames littered with hex code like %20. In a URL hex code is unsightly and hard to read.
Another great use of PowerShell commands is to flatten a folder system, to replace folders with metadata. Folders are useful if used on a Personal Computer and not share with anybody else. In a shared document system like SharePoint folders can be unwieldy through diverse nomenclature and structure depth. Please see my post on Taxonomy.
REST Query – Returns XML or JSON data such as
{“status”:”Ok”,”Data”:[{Obj1},{Obj2},{Obj3}]} which is an input option for reporting tools Power BI, Alteryx and data manipulation tools like SharePoint Designer.


Power BI has a great query setup to preprocess data before it feeds graphs. It can take many somewhat repetitive columns and reduce the number of columns by pivoting just those columns to one. Let’s say a list is columned such as below.
Digits are a representation of a part. In column names at the right of the dash, if M = Module, L = Lesson, A = Asset, then all we need are these 3 to be columns and a 4th Group column to be the identifier from the left side of the dash in headers.
In the Query Editor, columns in the first table are pivoted up on its side to form two columns with names and digits. The column of names is split in two, divided by the – dash, leaving a column of M,L,As. Change this column data to be Module, Lesson, Asset, respectively. Transform this column back to 3 columns heading: Module, Lesson, Asset. Power BI can compensate for lists of any type or databases, including REST queries.